- Published on Thursday, January 27, 2022, last updated
How to implement the Four Key Accelerate DevOps Metrics in 2024
Every efficient engineering teams aim to improve the way they build their software products and services. Through Accelerate, three researchers wanted to understand what works in a scientific way. Explore this article with us to uncover how implementing the Four Key DevOps Metrics can enhance both the productivity and well-being of your engineering team.
Dr. Nicole Forsgren, Jez Humble, and Gene Kim published the results of their years of research developed upon 23 000 datasets from international companies. Startups, enterprises, for-profit, not-for-profit are all part of this panel.
In Accelerate: The Science of Lean Software and DevOps: Building and Scaling High Performing Technology Organizations, you can learn what sets apart best performing engineering teams from the rest of the software world. This article aims to give you a high-level view of the importance of the Four Key DevOps Metrics, and how to track them.

Summary of the Four Key DevOps Metrics
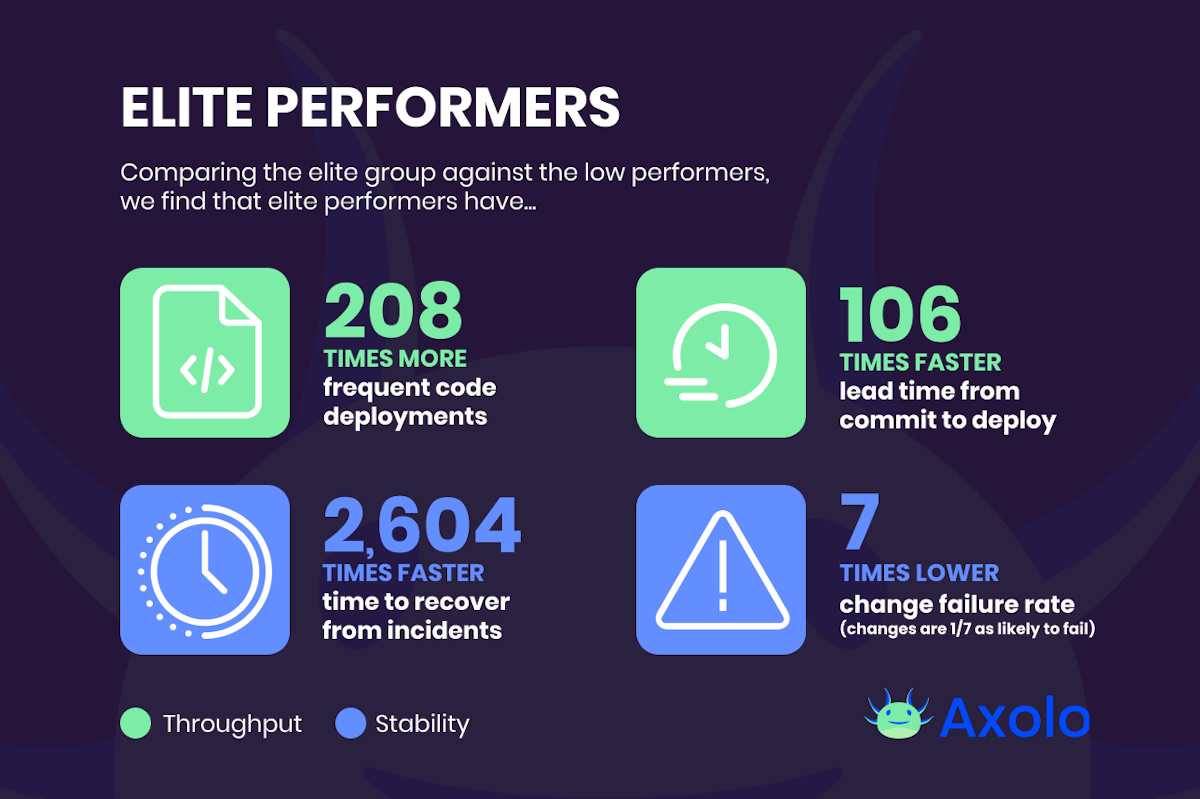
Is your engineering team using worldwide best practices?
| Accelerate metrics and definition | Best level | High level | Medium level | Low level |
|---|---|---|---|---|
| Deployment Frequency: Number of deployments in a given duration of time. How often does your organization deploy code to production or release it to end-users? | On-demand (multiple deploys per day) | Between once per day and once per week | Between once per week and once per month | Between once per month and once every six months |
| Cycle Time or Change Lead Time: Time to implement, test, and deliver code for a feature (measured from the first commit to deployment). How long does it take to go from code committed to code successfully running in production? | Less than one day | Between one day and one week | Between one week and one month | Between one month and six months |
| Mean Time to Recovery: How long does it take to restore service when an incident that impacts users occurs? | Less than one hour | Less than one day | Less than one day | Between one week and one month |
| Change Failure Rate: What percentages of changes to production result in degraded service and subsequently require remediation? | 0-15% | 0-15% | 16-45% | 46-60% |
Why are Accelerate metrics important for engineering leaders?
View these metrics not as the end goal for your engineering team, but rather as valuable indicators to monitor and refine your processes over time. As underlined by Dr. Forsgren in her talk; "The Key to High Performance: What the Data Says", rigorous implementation of these Key Metrics has shown that engineering teams in the best category are twice more likely to succeed with their commercial goals (profitability, market share, number of customers) and their non-commercials goals (quality of product or service and customer satisfaction). Dr. Forsgren concluded that teams performing well under these DevOps metrics reach a 50M higher market cap growth over three years.
Also, according to the Google State of DevOps 2018, there is a strong correlation between engineering well-being and successful implementation of these metrics. The report underlines that engineers from the Elite performer group "are 1.8 times more likely to recommend their team as a great place to work".
What are the four Accelerate metrics and their best practices?
The Four Key Metrics are as follows:
Deployment frequency
How often does your organization successfully deploy to production?
Deployment Frequency should be the easiest metric for you to collect. In opposition to the other metrics, it only needs one source of input. But be careful, we're talking here about frequency and not volume. You can't show daily deployment volume or grave an average number of deployments per week.
The only other setting to consider is what is a successful deployment for your organization. Do you include any kind of deployment? Deployments that will affect at least 10% of your user base? 50%? This is up to you to decide.
Best performing teams are considered to "deploy daily", meaning they successfully release in production almost every day. The four different kinds of behaviors underlined in Accelerate are as follows, which category described you best?
- On-demand (multiple deploys per day),
- Between once per day and once per week,
- Between once per week and once per month,
- Between once per month and once every six months.
Cycle Time or Change Lead Time
How long does it take for your organization to release a client request?
There are two schools of thought concerning Cycle Time, as one might be easier to track within your engineering team. You will require two pieces of data:
- the date when a customer requested a new feature or when the first commit of your engineer concerning this feature happened,
- the date when the deployment was successfully released.
Best performing engineering teams can release in production a new feature the same day the work started. Which statement is the closest to your organization? We can successfully release a feature started today:
- in less than one day,
- between one day and one week,
- between one week and one month,
- between one month and six months.
Change Failure Rate
How many percent of your deployments are the source of a new failure in production?
To follow your Change Failure Rate, you need to find the deployment that created each new incident in production. If most of your deployments create new incidents, you should try to release more often and with smaller changes to your codebase.
Best performing team deployments should have less than 15% to create new incidents in production. The four categories of Change Failure Rate are as follow, which one is yours?
- 0-15%,
- 16-30%,
- 16-45%,
- 46-60%.
Mean Time to Recovery
How long does it take to restore service when an incident that impacts users occurs?
To compute your mean time to recovery, you have to save:
- the date when an incident was created in production (not spotted, so we're talking about the date of the deployment),
- the date of the deployment that resolved the incident.
Best performing teams are able to resolve the incident in less than an hour. Which category best describes your organization? We can resolve incidents:
- in less than one hour,
- in less than one day,
- in less than one day,
- between one week and one month.
Conclusion of the Accelerate metrics
Given that adhering to these Four Key DevOps Metrics is widely recognized as a best practice for engineering teams today, we strongly encourage you to begin integrating them into your organization's practices.